-
Raquel Espiña from Keyweo has brought to us and infographic with the most popular and new tendencies for male and female names in the city of Barcelona during 2018. It has been made with the dataset 25 Most common baby names in Barcelona, disaggregated by sex published in the Open Data BCN portal.
-
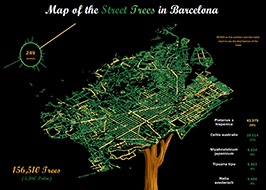
The publication of the dataset Street trees of the city of Barcelona has generated visualizations of high quality by various portal users. All of them can be seen in the subsection ‘Visualizations by themes’
-
Jorge Aznar has created an interactive map with the position of the Recycling oil container in the city of Barcelona based on the information published on the portal with the aim of facilitating the search for its location to the citizens. These searches are enabled by district and by neighborhood. According to Jorge's textual words "he likes the world of open data and also the Open Data BCN portal". From the City Hall, we're happy to listen to his opinion!
Source: Open Data BCN
-
 Dato Urbano: Barcelona collects, treats, visualizes and distributes data from the Open Data BCN portal
The Dato Urbano project processes and translates different datasets, from various Spanish localities, homogenizing their treatment in reference to the coordinates’ system, the geographic precision and the distribution format, using the standard open format: GeoJSON. The GitHub platform allows users to see the geographic displays on a map; despite this, the Dato Urbano project has developed adaptive geographic viewers. The project’s purpose is the use of the visualizations in studies about multitemporal evolution. The resulting visualizations of the processing of data obtained through the Open Data BCN portal can be found in a public repository of GitHub, specific to the city of Barcelona. This project’s alive and, so far, 9 datasets of mobility and services have been treated from the Open Data BCN portal.
Source: Open Data BCN
-
 Relation between the location of electric vehicle charging stations and the vehicle park of the city of Barcelona in 2016
Pol Masclans Abelló, a student of the Bachelor in Industrial Technologies Engineering UPC who has been working on the Open Data BCN service at the IMI (Institut Municipal d’Informàtica) has created a map that relates the charging stations for the electric vehicles in the city of Barcelona with the age of vehicles registered in the city, using the data from the Open Data BCN Portal.
The interactive map allows you to select different layers, such as the percentage of vehicles with 10+ years old or 20+ years old, grouping by neighborhoods or districts. The aim is to highlight the antiquity or not (according to how it is valued) of the car park of the citizens of Barcelona and to publicize the possibilities that exist for electric vehicle chargers for those who want to acquire a Plug-in vehicle.
The visualizations has been made using the datasets Barcelona's electric vehicle charging stations and of the Age of car of the city of Barcelona, with data from 2016. In that same year, there were 580,399 cars registered in the City of Barcelona.
Source: Open Data BCN
-
 Visualization of centres of worship by neighbourhood, linked to the birthplace of Barcelona citizens
 Ferran Pérez Gamonal , a final-year student of audiovisual systems engineering at the UPC School of Telecommunications Engineering, has spent the months prior to his graduation working on the Open Data BCN project at the IMI (Municipal Institute of Information Technology). Using data published on Open Data BCN, he has produced a visual display of data on centres of worship by neighbourhood linked to the birthplace (Catalonia, Spanish state and elsewhere) of Barcelona citizens . This is an interactive map that allows users to select the various layers.
Source: Open Data BCN
-
Iban Tarrés, a geographer and GIS specialist, has produced a map of free Wi-Fi hotspots in Barcelona. This visual display has been created thanks to the information set published on the Open Data BCN portal. The map shows areas with more or less access point density
Source: Open Data BCN
-
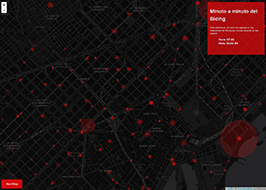
The publication of the dataset on Bicing Stations (Mechanics and electrics) in the city of Barcelona" has generated visualizations of high quality by various portal users. All can be seen in the subsection 'Visualizations by themes'.
-
The architecture studio 300.000 Km/s has produced the interactive map Geographies of innovation, a visual display of the various innovative initiatives currently under way in Barcelona. The map offers a selection of innovative initiatives, start-ups, companies, research centres and universities produced by Infonomia, and locates them on four different layers that provide information on the socio-demographic situation, the level of services and transport and the type of land use, among other things. That required the use of various Open Data BCN information sets (demographics, levels of income, unemployment and rents) and other data sets from TMB, Flickr, Google Places and the property register.
Source: Open Data BCN
-
Carlos Carrasco, a researcher from the Cities in Motion centre at the IESE Business School and a member of Eixos.cat, has produced a visual display of open data on public transport accessibility in Barcelona (metro, bus, FGC and Tram) depending on the distance and resident population density in each block. Carrasco used portal data to determine the boundaries and population of the blocks, and the geolocalisation of the public transport stops.
Source: Open Data BCN
-
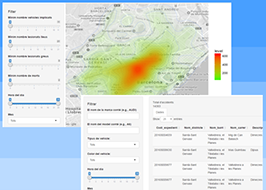
The publication of the dataset on accidents managed with by the local police in the city of Barcelona has generated visualizations of high quality by various portal users. All of them can be seen in the subsection 'Visualizations by themes'.
-
The 300.000 Km/s studio carried out the atNight project to reflect on the features that define Barcelona’s nightscape. One of the mappings that came out of this initiative is the one below, entitled “Movement vs. Density”, which seeks to illustrate how road space and private space correspond. To achieve that, a layer generated from the geolocalised routes of part of Barcelona’s taxi fleet is contrasted with the population density by block taken from the Open Data BCN portal.
Source: Open Data BCN
-
Carlos Carrasco, a researcher from the Cities in Motion centre at the IESE Business School and a partner at Eixos.cat has created a visual display of the population density at block level in Barcelona, based on data supplied by the city’s Open Data portal. Carrasco, a data visualization enthusiast, has produced up to four different visualizations of this concept: with and without the street guide included, and with and without areas of less density. The specific visualization we offer in this space does contain the city street guide but does not include the minimum values, which take up a lot of space on the map and provide little information of any relevance.
Source: Open Data BCN
Data visualizations
From 2/2017 to 1/2024, in this section we have given visibility to the visualizations made with data published in Open Data BCN.


 Visualizations of the dataset "Street trees of the city of Barcelona"

 Visualizations of the dataset on "Bicing Stations (Mechanics and electrics) in the city of Barcelona"

 Visualizations of the dataset "Accidents managed by the local police in the city of Barcelona"

Add new comment
Log in or register to post comments