Barcelona Dades Obertes Challenge Third edition(Virtual*)_2020. Finalist Projects
- Presentation
- Finalists projects
- Opinions and general considerations of the jury
Given the exceptional circumstances arising from COVID-19, the Barcelona Dades Obertes Challenge Third edition_2020 has evolved to adapt to this new context that has come about unexpectedly, first modifying the calendar and then, orienting the criteria for presenting projects to a telematic and virtual format.
The objective has always been to offer the maximum facilities for participation and to give maximum visibility to the projects that the students have carried out with great dedication and effort, under the guidance and accompaniment of their teachers. However, we are aware that the circumstances have not been easy and some schools have not been able to deliver the work done.
Therefore, in this unexpected context, the organisation of the Barcelona Dades Obertes Challenge Third edition(Virtual*)_2020 considers all the projects presented as finalists and will give the educational centres and the authors of the projects a personalised diploma from the Barcelona City Council accrediting their participation.
Below we show all the finalist projects in alphabetical order, with the assessments and recommendations that one member of the jury of experts in the challenge make specifically to the authors of each one of them.
Educational center: Escola Virolai
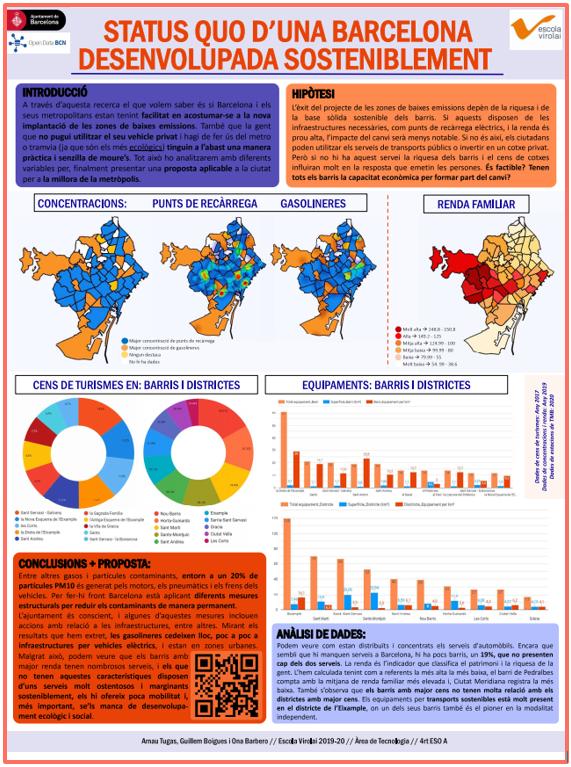
Project: Status Quo d'una Barcelona Desenvolupada Sosteniblement
Author/s: Arnau Tugas, Guillem Boigues and Ona Barbero
Tutor: Albert Pozo
Grade: 4t E.S.O.
![]()
Infographics, report and presentation video:
Jury's assessment
Comment: It is a project with an ambitious objective that is well explained and supported (good introduction and additional information). However, the data used do not have sufficient depth to answer the question posed, and their analysis is not very extensive due to the simplicity of the data selected. This leads to conclusions that are interesting but have little connection with the content of the analysis. The ingraphics are certainly interesting and well thought out, with techniques such as the use of heat maps and the correct use of pie charts. However, I recommend the principle of "less is more" as it can sometimes seem too much for the observer.
Highlight: From the infographics it is worth mentioning on one hand the creative use of heat maps as well as various data representation techniques: Bar charts, circular sections and maps. On the other hand, from the report we must mention the introduction to the topic, presenting the problem, the analysis and the starting hypothesis and the edition of the text.
Proposal for improvement/continuity: To improve the work it would be good to expand the analysis started both in scope (more datasets) and in depth (more analysis). It would be necessary to expand the analysis and define concrete questions to be answered with the data, which would allow to focus on the main issue to see which neighborhoods are more prepared to make the ecological transition. In the quantitative field, it would be good to compare neighborhood values and see correlations between income and other socioeconomic indicators. It would also be good to analyze the data on population concentrations available on the open data portal. In the area of infographics, it would be good to use a map of differences between refueling points and gas stations and present both the % and absolute values in the pie charts. With regard to the bar chart, it may also be a good idea to represent the relative differences between neighbourhoods, to highlight the imbalance between them.
Assessment by: Oleguer Sagarra
Educational center: Institut Josep Comas i Solà
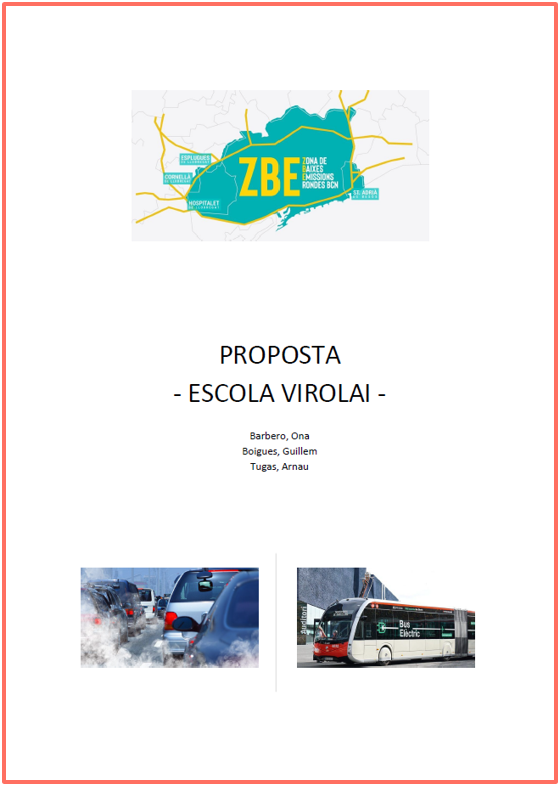
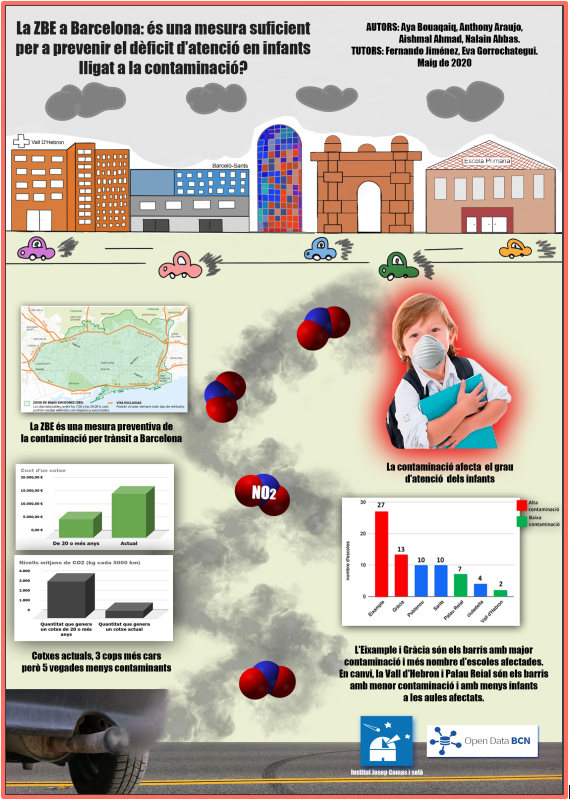
Project: La ZBE a Barcelona: és una mesura suficient per a prevenir el dèficit d'atenció en infants lligat a la contaminació?
Author/s: Aya Bouaqaiq Benabed, Anthony Araujo Gómez, Aishmal Ahmad Bahawal and Nalain Abbas
Tutors: Fernando M. Jiménez and Eva Gorrochategui
Grade: 4t E.S.O.
![]()
Infographics, report and group photo:
Jury's assessment
Comment: The theme of the project is original, topical and with impact. The report presents a very precise description of the problem in the introduction, marking very clearly the objectives, selecting the datasets and making a correct analysis of them, with a good structure and presentation.
Highlight: It is a work with well-defined objectives, aligned with the data used, very good justification (including a literature search), good methodology and a very good report.
Proposal for improvement/continuity: There are two main points for improvement: the infographics and the section on criticism and limitations. The computer graphics do not completely represent the work done and do not answer the question posed. In the section on criticism and limitations it would be interesting to reflect on whether the ZBE in Barcelona is a sufficient measure to prevent childre attention deficit linked to pollution.
Assessment by: Helena Ramalinho
Educational center: Institut Dr. Puigvert
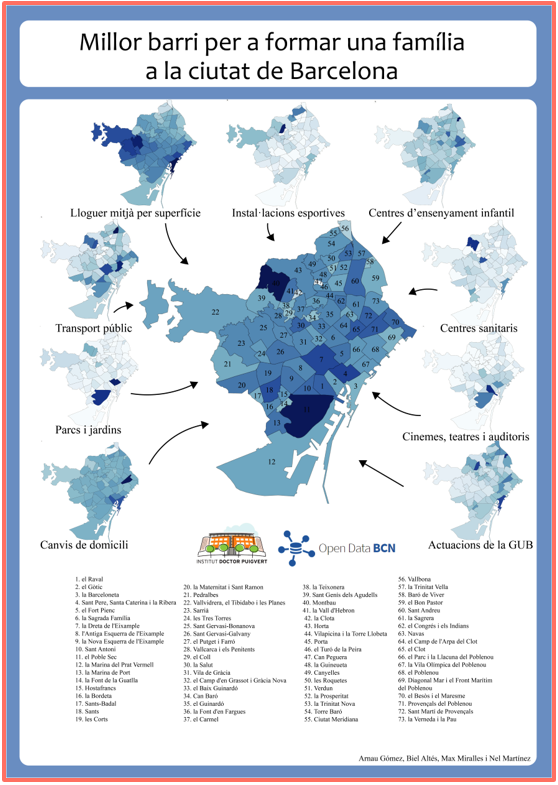
Project: Millor barri per formar una família a la ciutat de Barcelona
Author/s: Arnau Gómez, Biel Altés, Max Miralles and Nel Martínez
Tutors: Choni Morillo, Cristina Lluch and Oriol Ventura
Grade: 1r Batxillerat
![]()
Infographics and report:
Jury's assessment
Comment: Both the report and the infographics are very well worked and achieved. The objective is well defined and represents an innovative and current contribution. The data used is appropriate for the objective set and, moreover, as they are used in the analysis, the reason for their selection is justified. The methods of analysis are clearly explained and are suitable for achieving the objective set and, therefore, the conclusion is correct. In the infographics, the design and representation elements used to visualise both the final result and the way in which it has been obtained (methodology and analysis) have been very accurate. The only important thing missing is the legend where the interpretation of the colour gradation in the maps is presented.
Highlight: The project in general is excellent, but if there is one aspect that needs to be highlighted, it should be the self-critical capacity that is shown when reflecting on the project itself. In particular, its possible limitations as well as the way in which these could be solved.
Proposal for improvement/continuity: The project can be improved in two aspects: first, in all the representations a dark colour is used to represent the desirable aspects. However, in the case of the incidents, this is inverted and the dark colour becomes the undesirable aspect. This breaks the homogeneity in the way the data is represented. In order not to create confusion, it could represent, for example, the security, which could be obtained by the inverse of the number of incidents. Second, there is no justification for the reason why the weighting of each variable has been chosen. Although the report recognises the subjective nature of this weighting, it is precisely for this subjectivity that there is a lack, more than in any other case, of a justification for why this weighting was decided and not another one.
Assessment by: Laia Albors
Educational center: Institut Quatre Cantons
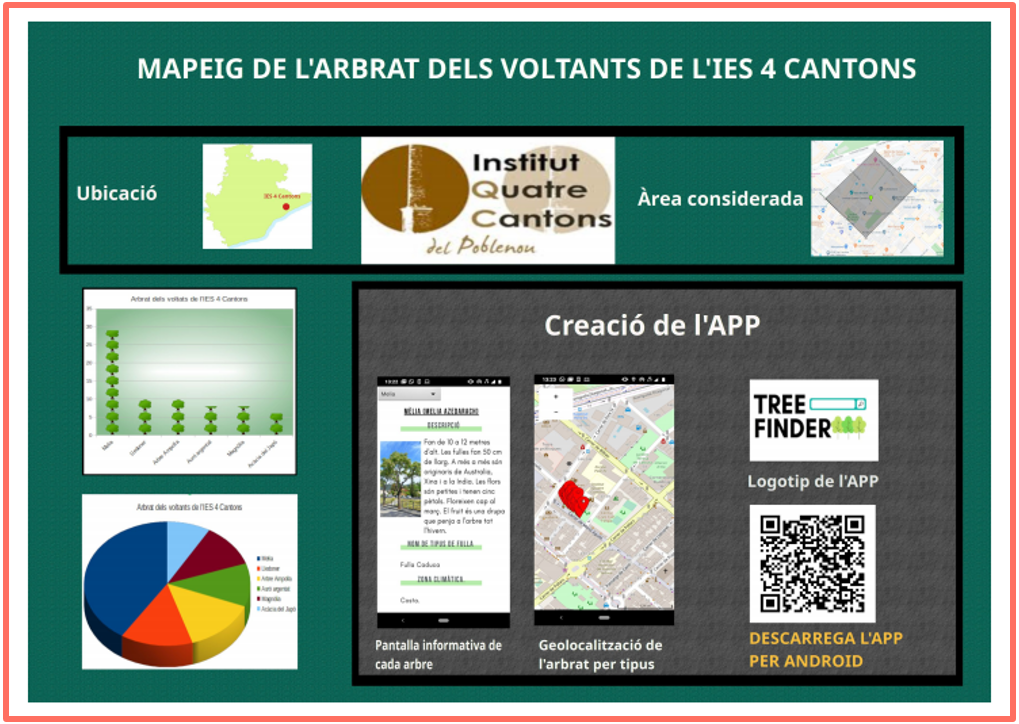
Project: Mapeig de l'arbrat dels voltants de l'IES 4 Cantons
Author/s: Amin el Alma, Àlex Cebriano, Manel Gutiérrez, Eloi Puig, Jaume García and Gerard Sancho
Tutor: Joaquim Font
Grade: 3r E.S.O.
![]()
Infographics and information APP TREEFINDER:
Jury's assessment
Comment: The TreeFinder project develops a mobile application on an open data set in Barcelona: the georeferenced tree of streets. The central axis of the work has been the development of the application that allows us to visualize this woodland in a specific area of Barcelona on a map in the mobile.
Highlight: The development of a mobile application is a complex but very valuable exercise for students and from this point of view it is a very interesting job. Moreover, the approach, based on using the application as a link between external data and a specific place in the real world, can be a good basis for thinking beyond technology and having a critical view on its uses.
Proposal for improvement/continuity: The application could be used as a basis for doing more value-added work from data analysis. For example, show the woodland around an institute/place in Barcelona and visualize the differences between that institute/place and the rest of Barcelona. With this the user would be aware not only of what is around him but also of its shortcomings, privileges or potential for improvement.
Assessment by: Jordi Vitrià
Educational center: Institut Vila de Gràcia
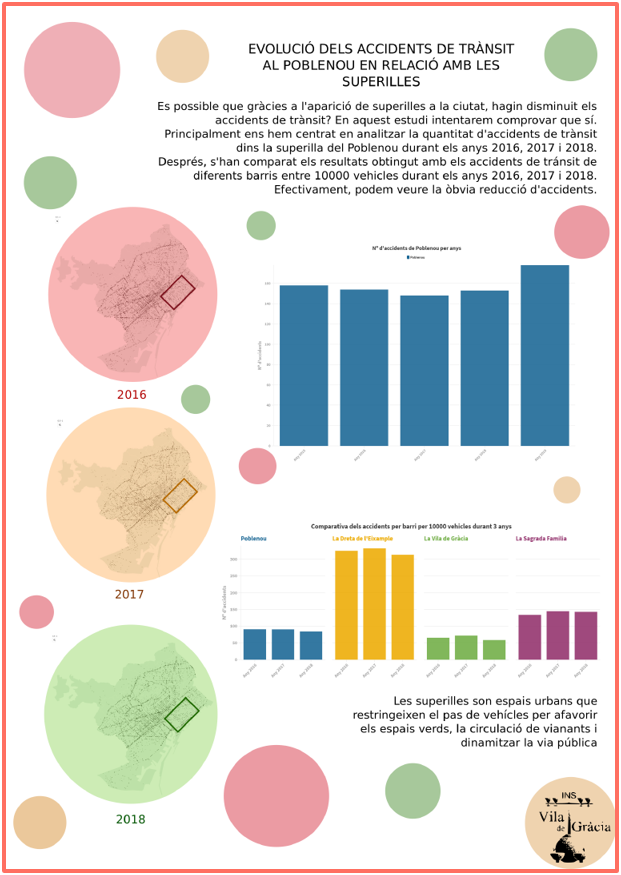
Project: Evolució dels accidents de trànsit al Poblenou en relació amb les superilles
Author/s: Valentina Ávalos, Robin Gill, Marcel Estrella and Joel Rocasalbas
Tutors: Laura Conti and Reyes Peiró
Grade: 4t E.S.O.
Infographics and report:
Jury's assessment
Comment: The project "Impacte de les superilles en els accidents de trànsit" of the students of the Institute Vila de Gràcia, proposes to evaluate from open data the case of the supermanzana of Poblenou. The work uses geolocated data of traffic accidents in Barcelona, and compares its evolution from the implementation of the superblock.
Highlight: Even though the project was developed in a context complicated by confinement, the authors have made a very interesting and topical job. From the approach of their teachers, the methodology followed is detailed, and how it was affected by the confinement. Thanks to the geolocated data of traffic accidents, the students have been able to analyze the evolution of these accidents and to relate it to the implantation of the supermanzana, making a comparison between different years and neighborhoods. The project concludes that there have been fewer accidents in the area since the implementation of the superblock.
Proposal for improvement/continuity: Graphically, the area of interest could have been expanded to better visualize the data, and to understand at a glance the impact of the supermanzana. To complete and support the conclusions of the project, already from the same set of data, one could compare the number of accidents with years before the implementation of the superblock, as well as distinguish between types of accidents (for example, vehicles involved). In the future, when supermanzanas are consolidated in other areas of the city, the impact between them could be compared to rule out other causes. Finally, the data could also have been crossed with pollution rates to validate the impact from an environmental perspective.
Assessment by: Joan Melià
General considerations of the jury
Comment: First of all, I would like to congratulate all the centres that have participated in this third edition of the Barcelona Dades Obertes Challenge, since the main objective of this event has been fulfilled: to introduce the open data in the educational centers of the city. All the projects have done important work with open data sets, in order to check the correction of the hypothesis raised, according to the analysis, transformation and correlation of these data.
Highlight: All the projects have presented a final result. Most in the form of infographics and one of the projects even, has developed a mobile application. In this sense, the effort made in all the projects should be highlighted,
given the current health situation.
Proposal for improvement/continuity:
In order to improve, the following sections should be emphasised:
- Datasets used: It would be interesting to use more datasets that allow interrelate more variables, and very importantly, justify why they have been chosen and where they have been obtained from.
- Analysis of the data: This section must be worked on further, justifying and reasoning each choice.
- Project report: This is a vital basic pillar in any project. The report describes the objective of the project, the initial hypotheses, the methodology used, the decisions taken and the justification for them. All the projects have had some "obstacle" in this section.
- Graphical representation-infographics: This is the final result of the project and it is usually where everyone puts more attention. An infographic tries to show the answer to the question it raises. In this section we must care for consistency, both in the colours used and in the graphic elements. How much 'clean' the infographic be, better. You have to avoid filling it with excessive text, which distracts or "complicates" the observer perception.
Assessment by: Enric Rubio
To all those who have been able to finish their projects as well as to those who have not been able to, the organization the organization congratulates them and sends their recognition and thanks for the effort, interest and adherence to the initiative.
We hope that both the students and the teachers who have had the opportunity to work with this new educational resource, the open data, has been an enriching training experience and will be useful in the future.
We would also like to thank the jury, renowned teachers and professionals, who offer their time and experience in a totally altruistic and disinterested way, playing a fundamental role in this competition.
Finally, Mr. Màrius Boada, Director of the Municipal Data Office of Barcelona City Council, closes this edition by congratulating all the contestants and at the same time expressing his desire to make a new edition in a more favorable environment than this year.