

On the 9th of November, 2020, the jury of the World Data Viz Challenge 2020 Barcelona-Kobe, formed by people specialized in urban planning, data analysis and the impact that digital transformation has on citizens, has agreed to grant the

and the

to the project
Nivell educatiu de la població de Barcelona
Author/s: Marina Rosell Murillo and Raúl Higueras Serrano, students at the Polytechnic University of Catalunya - UPC.
Description: This visualization, aligned with the 4th Objective about Quality Education of the Sustainable Development Goals (SDG), shows the relationship that exists between the educational level of the citizens of the city of Barcelona, their socioeconomic status and sex. An analysis of the educational level of each neighborhood, focusing on the average income and gender of the citizens in order to have information that facilitates decision-making in education.

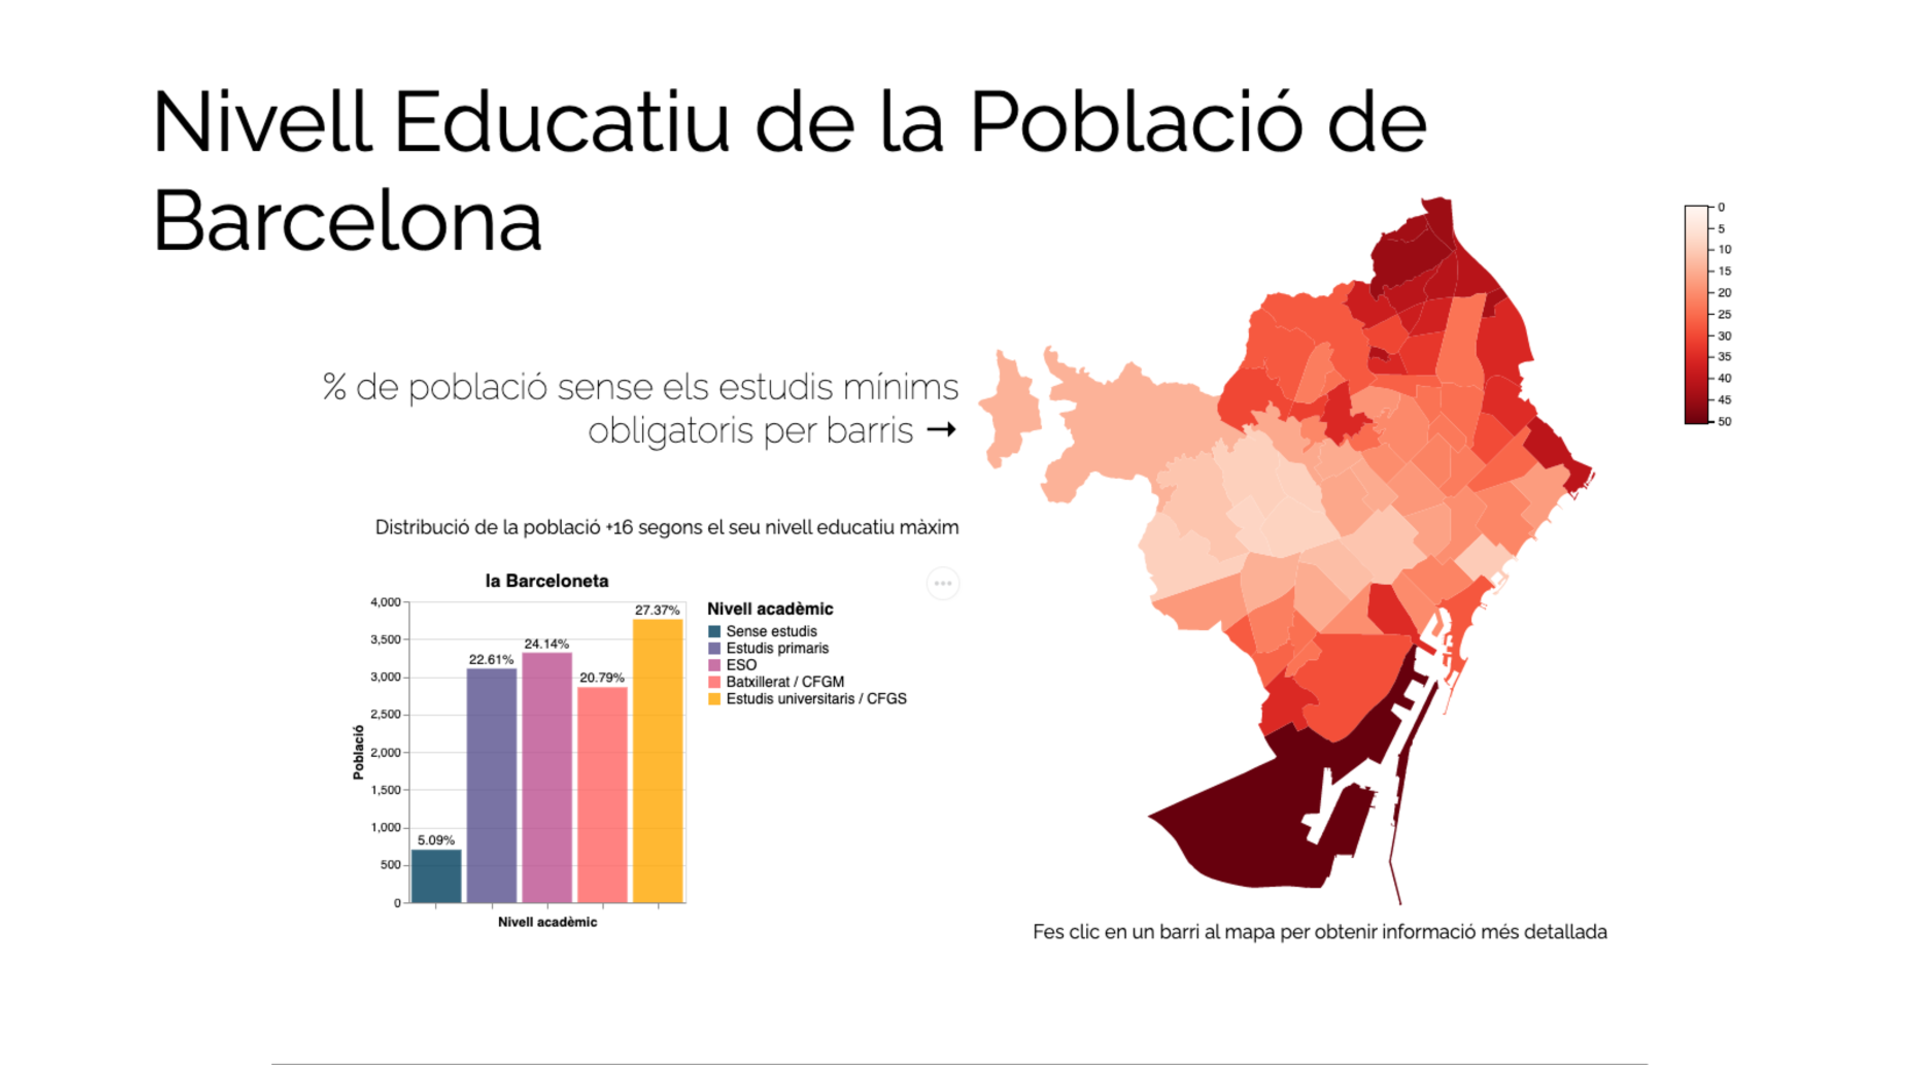
In this edition, the two prizes of the contest fall in the same visualization since, in addition to being the best valued by the jury, it has agreed in being also the best work presented by university students.

The jury also considered as finalists of the Barcelona call the following four projects, which are listed in alphabetical order of title.
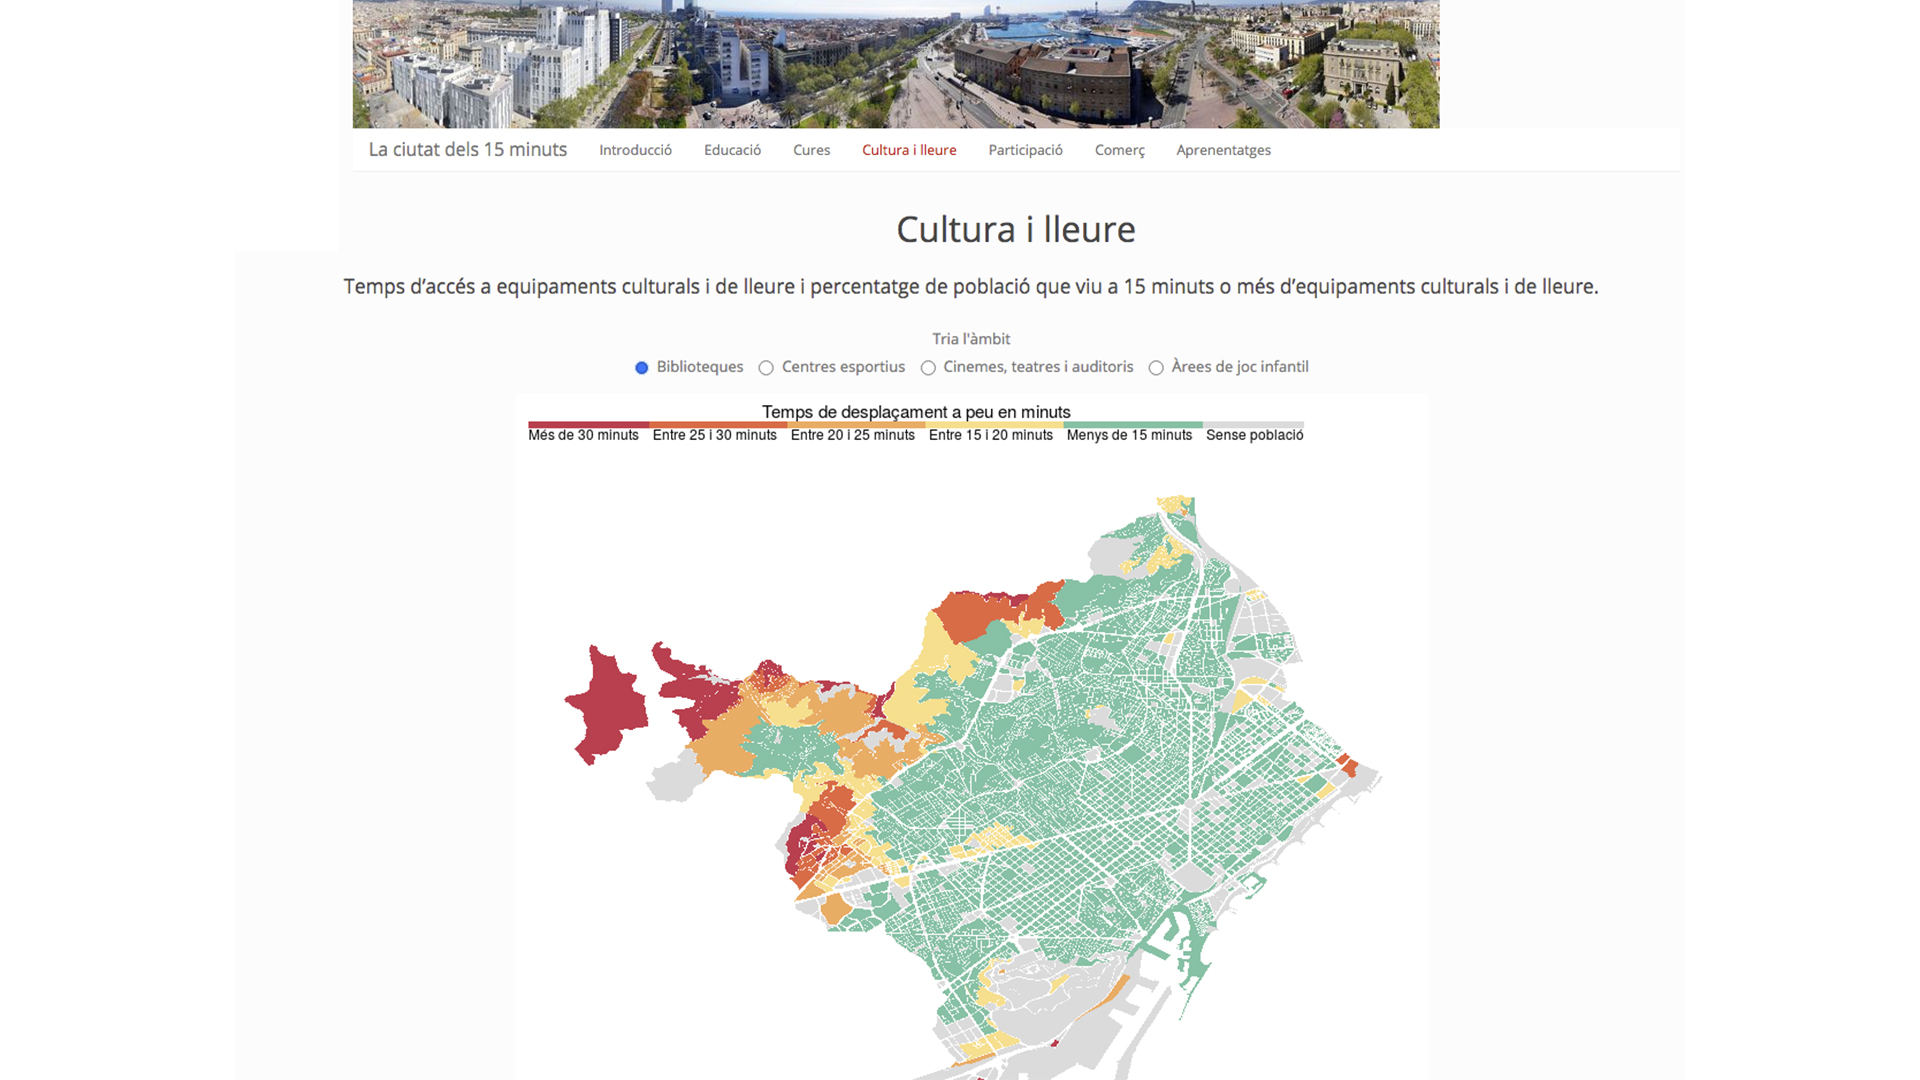
Barcelona, la ciutat dels 15 minuts?
Author/s: Roger Barres González, researcher at Pompeu Fabra University and the Carles Pi i Sunyer Foundation, Marçal Farré Ribas, analyst at the Catalan Institute for the Evaluation of Public Policies (Ivàlua) and Laura Paéz Gimeno, manager of evaluation and analysis projects to the Agency for Business Competitiveness (ACCIÓ) of the Generalitat de Catalunya.
Description: According to its proponents, a 15-minute city is a decentralized, multifaceted and multi-service city in which its citizens only have to walk for 15 minutes to meet their essential needs. In this dataviz, the accessibility to the different services can be evaluated from anywhere in the city.
CRASH
Author/s: Laura Navarro Soler, data journalist, and Xavier Vivancos García, Business Intelligence consultant.
Description: This data visualization is intended to give users all the necessary tools to make better mobility decisions, take precautions and demand change in order to make the mobility within the city safer. An interactive application allows the user to see the number of accidents based on filters, such as vehicle used, day of the week, time of day, district and neighbourhood.
VIOLÈNCIA DOMÉSTICA BARCELONA
Authors: Beatriz Prado, industrial engineer specializing in petroleum products and engines and Nathalie Richer, autonomous designer and developer of the Tableau visual analysis platform.
Description: Which is the relation between the educational levels and the economic situation and gender of the citizens? This dataviz analyses the educational level of each neighborhood focusing on average income and sex of the citizens to obtain information which facilitates decision-making in terms of education.
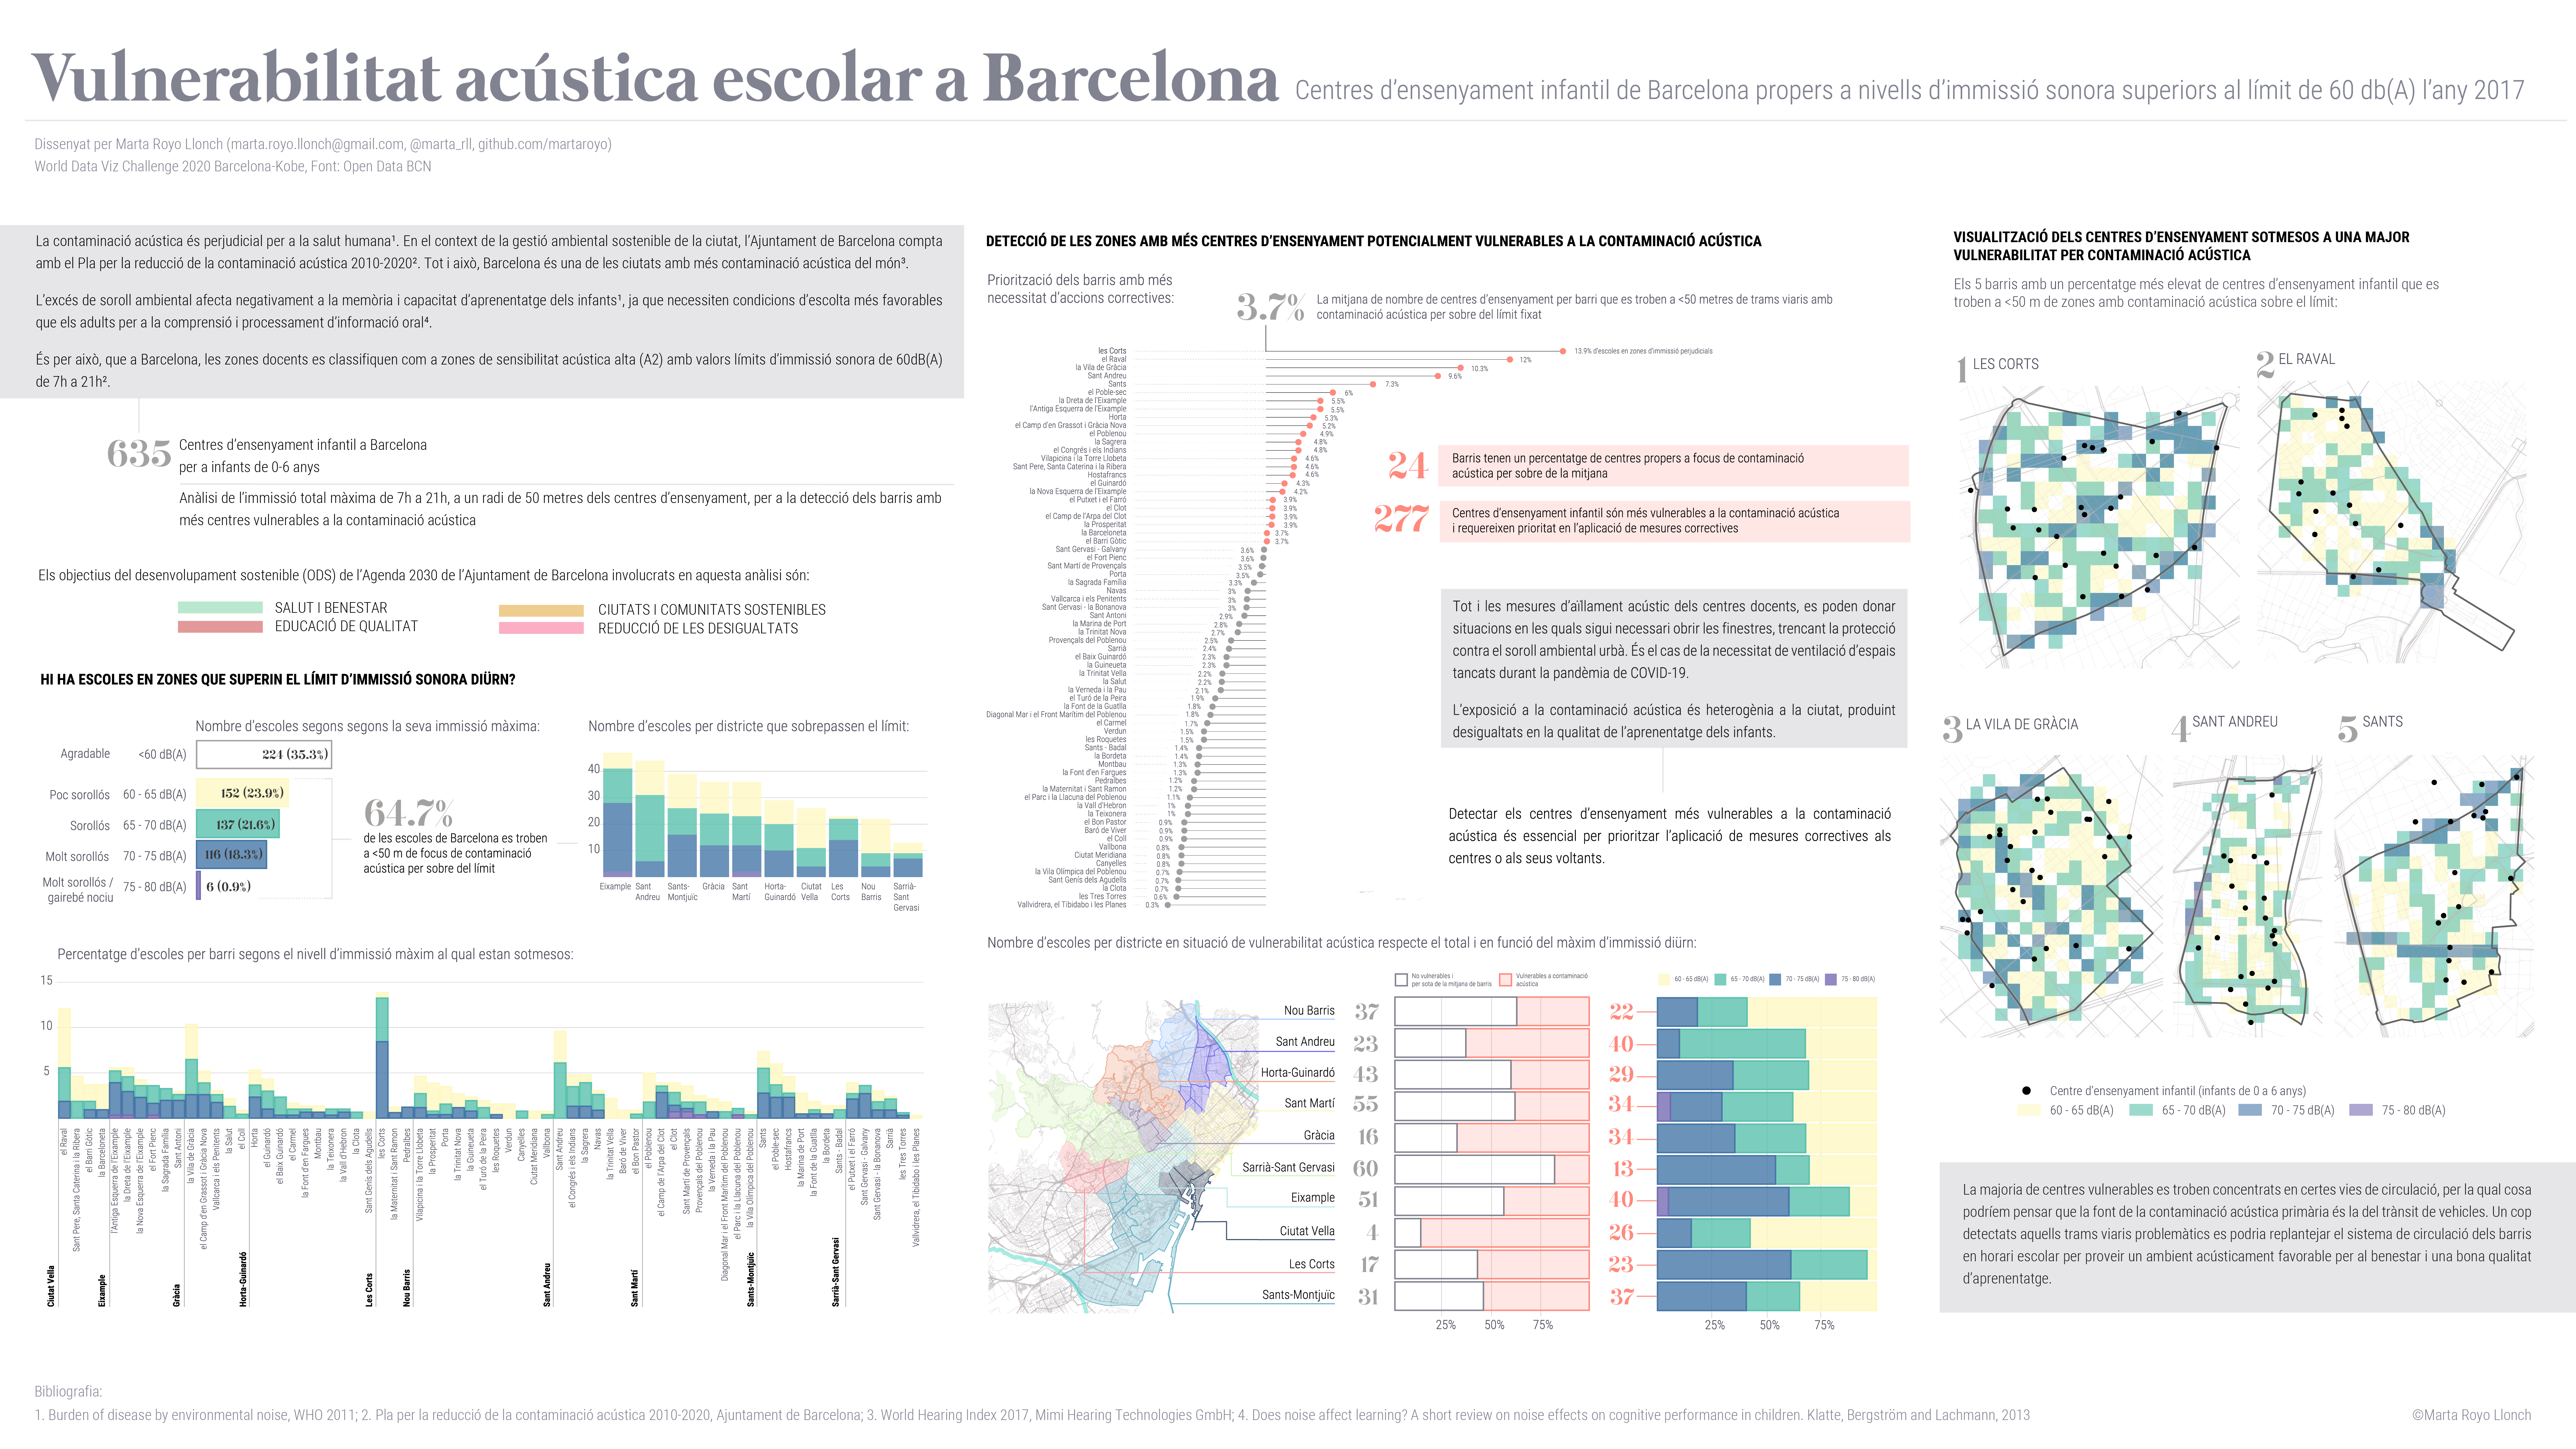
Vulnerabilitat acústica escolar a Barcelona
Author: Marta Royo Llonch, researcher at the Institute of Marine Sciences of the Consejo Superior de Investigaciones Científicas (CSIC).
Description: Excessive environmental noise negatively affects children's memory and learning ability. This visualization detects the areas of Barcelona where there are a greater number of early childhood education centres with noise pollution above the limit, with the aim of promoting public policies that prioritise resources in these areas.